Retriev BI Anatlytics

Our Solutions

Explore analytics services by business area

Sales & Revenue

What we cover

  • Revenue tracking by product, category, region, or channel
  • Sales performance versus targets
  • Margin and profitability analysis
  • Customer purchasing behavior and segmentation
  • Product and category performance
  • Revenue trend and demand forecasting.

Typical KPIs

  • Revenue
  • Gross margin
  • Sales growth
  • Average order value
  • Top products
  • Top customers
  • Conversion or win rate

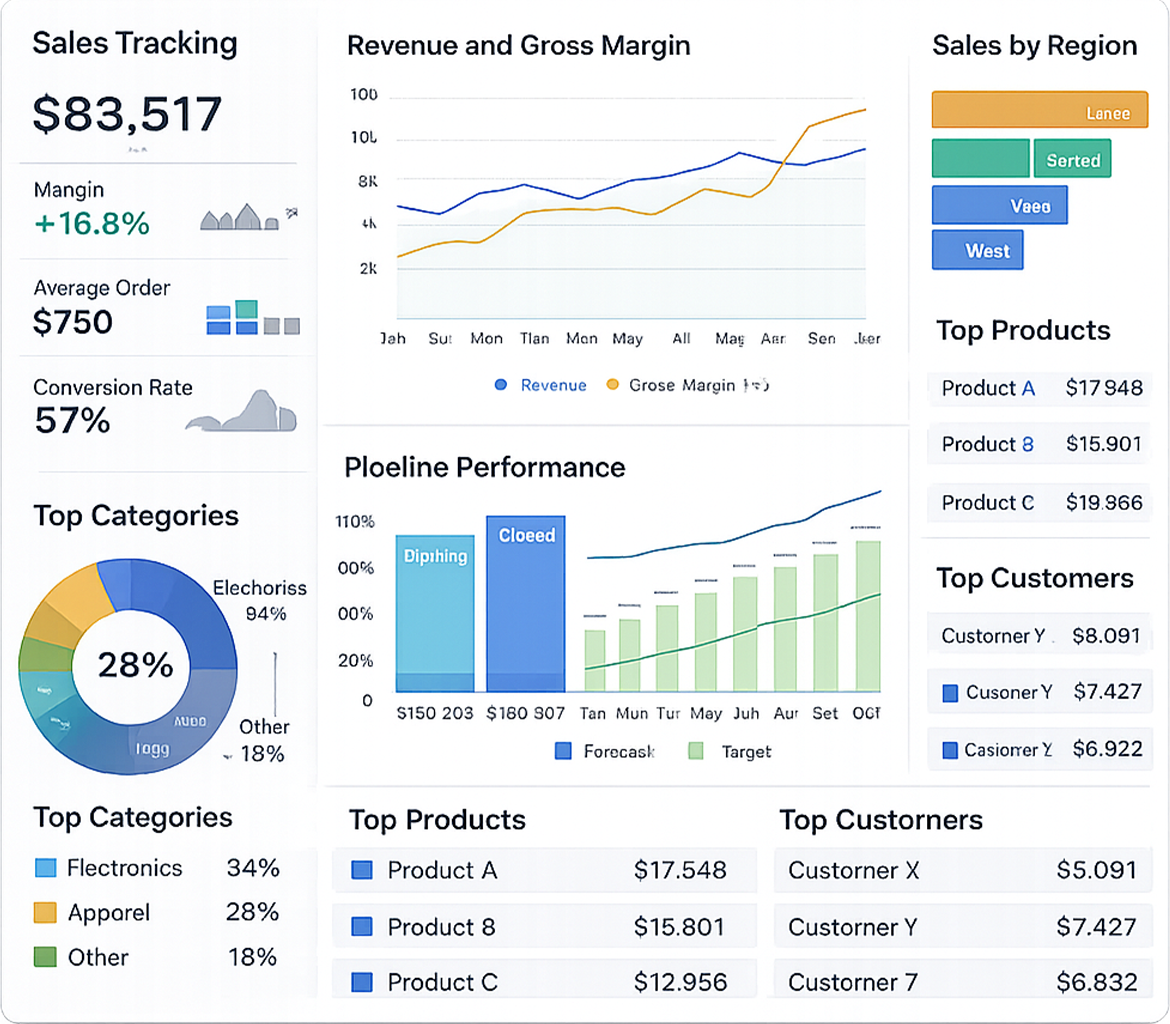
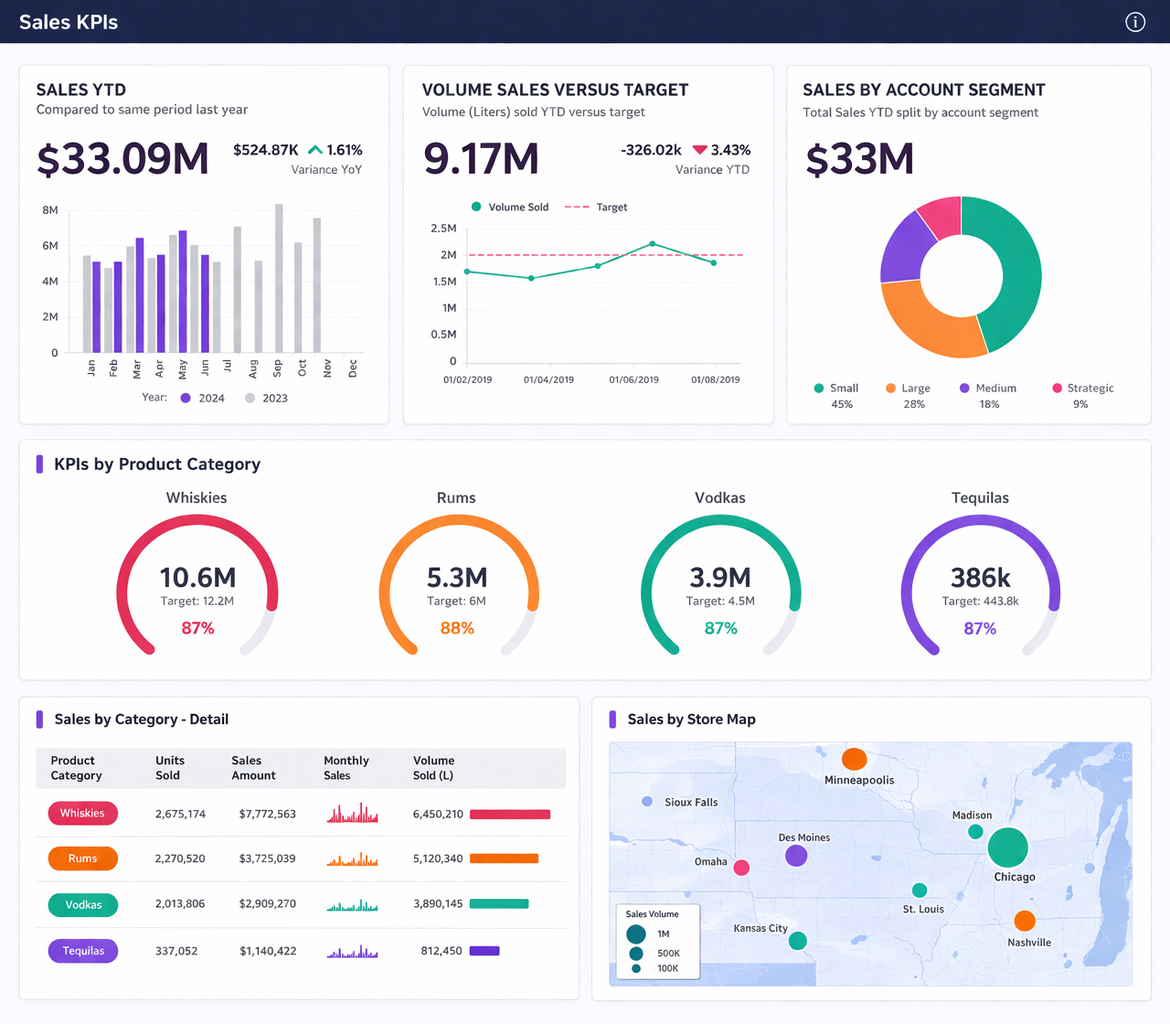
Understand what drives growth, margin, and customer demand with dashboards built for commercial performance. We help businesses track revenue trends, product performance, sales targets, customer behavior, and channel effectiveness in one clear view.

Finance & Profitability

Transform finance data into management insight with dashboards for profitability, cost control, budget performance, and cash visibility. We help businesses move from static reporting to clearer financial decision-making.

What we cover

  • Profit and loss dashboards
  • Budget versus actual reporting
  • Cost center and expense analysis
  • Cash flow visibility
  • Receivables and payables monitoring
  • Profitability by customer, product, or business unit.

Typical KPIs

  • Gross profit
  • Net profit
  • EBITDA
  • Budget variance
  • Operating expenses
  • Cash position
  • Receivables aging
  • Payables aging

Inventory & Supply Chain

Improve stock visibility, planning, and replenishment with dashboards that show where inventory stands and how efficiently it moves. 

What we cover

  • Stock visibility across warehouses or locations
  • Inventory turnover and stock aging analysis
  • Reorder planning and stock coverage monitoring
  • Stock movement and replenishment tracking
  • Lead time and fulfillment performance
  • Slow-moving and obsolete inventory insights

Typical KPIs

  • Stock on hand
  • Inventory turnover
  • Days of inventory
  • Stockout rate
  • Fill rate
  • Backorders
  • Supplier lead time

Vendors & Procurement

Gain better control over purchasing activity, supplier performance, and procurement efficiency. We design dashboards that help businesses understand spend patterns, supplier reliability, pricing trends, and process delays.

What we cover

  • Supplier scorecards and vendor performance
  • Spend analysis by supplier or category
  • Procurement cycle monitoring
  • Purchase order tracking
  • Delivery performance and lead times
  • Price variance and purchasing trends

Typical KPIs

  • Spend by vendor
  • On-time delivery rate
  • Purchase lead time
  • Purchase price variance
  • Open purchase orders
  • Supplier dependency
  • Procurement cycle time

Business  Performance

What we cover

  • Operational KPI dashboards
  • Process efficiency and turnaround time
  • Service or production performance
  • Bottleneck and delay analysis
  • SLA and exception tracking
  • Cross-functional business performance reporting

Typical KPIs

  • Cycle time
  • Throughput
  • Utilization
  • Completion rate
  • Delay indicators
  • Service level performance
  • Productivity trends

Measure how the business is really performing across processes, teams, and daily operations. We build dashboards that help organizations track efficiency, identify bottlenecks, and improve overall operational control.

HR & Workforce Performance

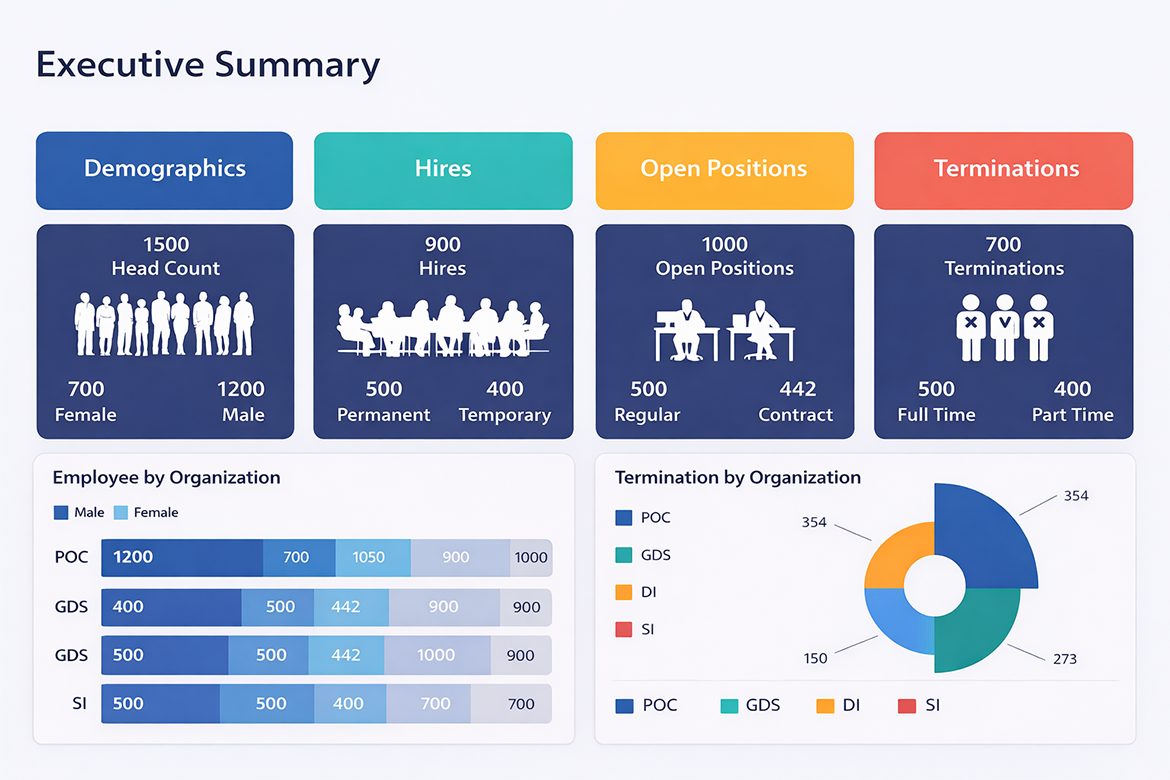
Support people and workforce planning with dashboards that show headcount trends, attendance, turnover, productivity, and department-level workforce performance.

What we cover

  • Headcount and workforce distribution
  • Attendance and absence analysis
  • Employee turnover and retention trends
  • Overtime and workload visibility
  • Department productivity reporting
  • Workforce cost monitoring

Typical KPIs

  • Headcount
  • Turnover rate
  • Absenteeism rate
  • Overtime hours
  • Workforce cost
  • Productivity by department
  • Retention trends

Executive & Management

What we cover

  • Company-wide KPI scorecards
  • Cross-department performance dashboards
  • Monthly and quarterly management reporting
  • Strategic trend and variance tracking
  • Business health and performance summaries
  • Risk and exception visibility
  • Threshold-based monitoring and critical issue flags

Typical KPIs

  • Revenue summary
  • Profitability summary
  • Cost performance
  • Department scorecards
  • Target versus actual performance
  • Trend indicators
  • Risk and exception flags

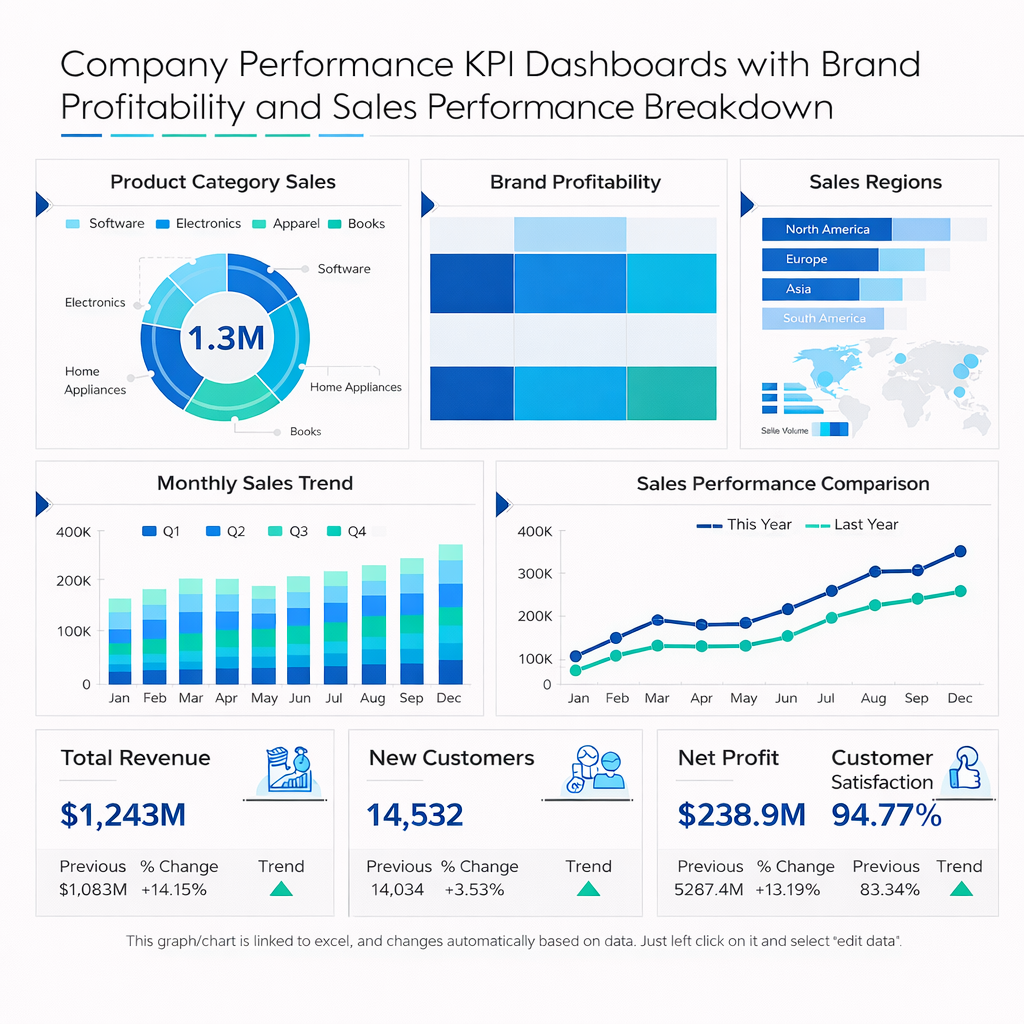
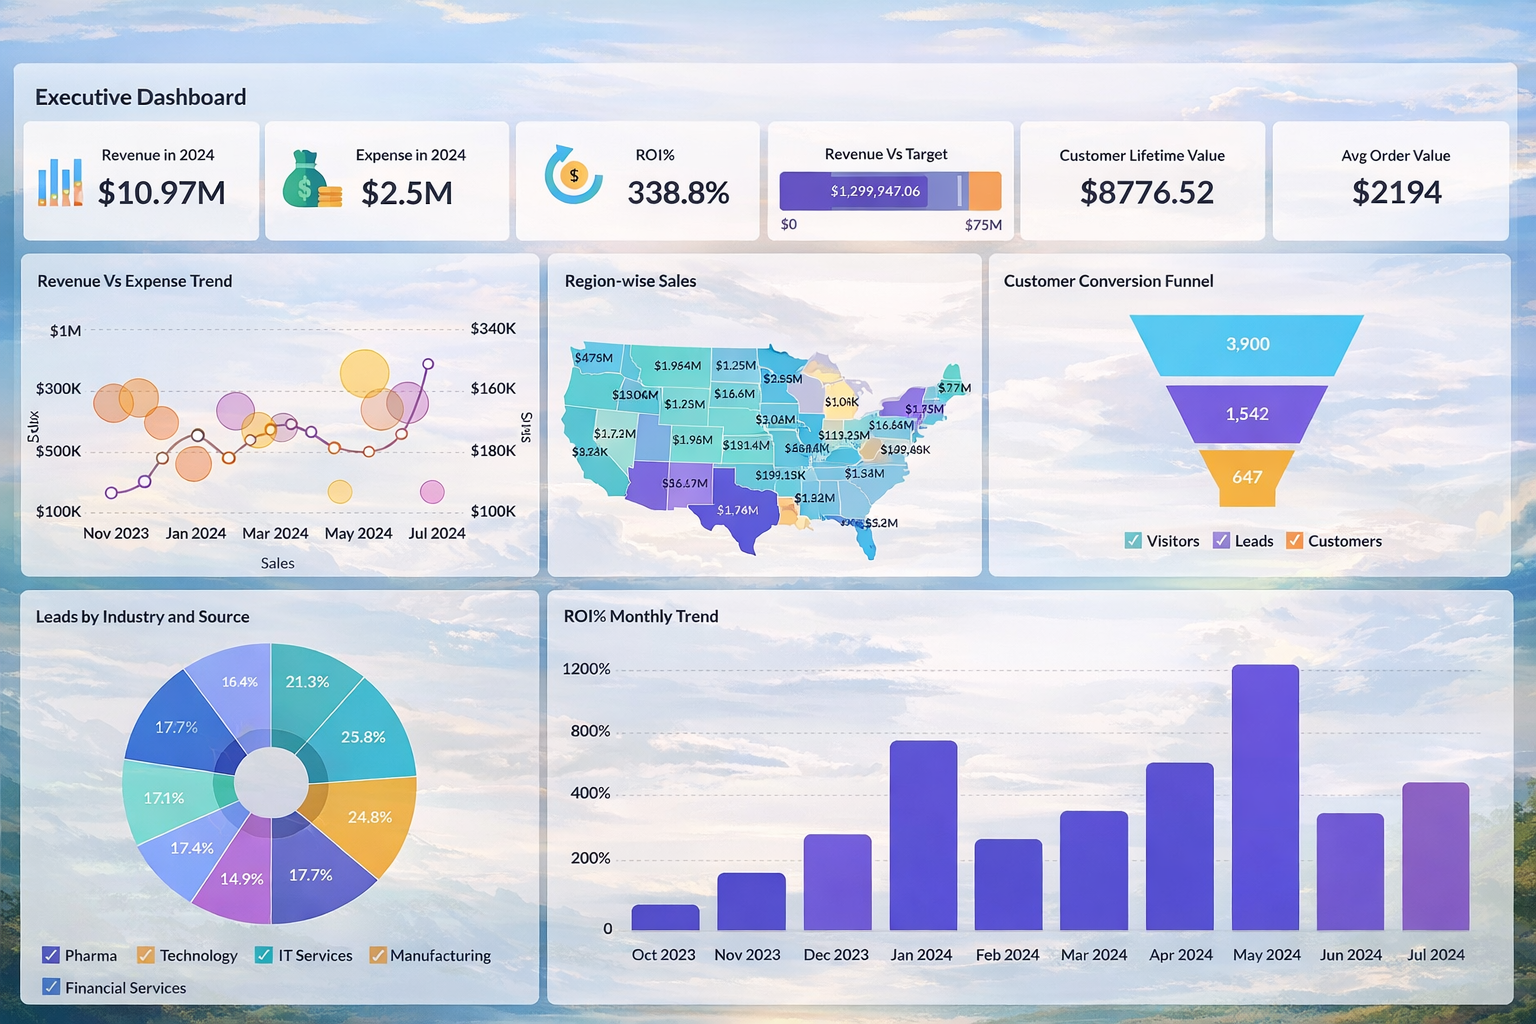
Create a high-level view of business performance for management, directors, and owners. Executive dashboards bring together financial, operational, commercial, and departmental KPIs into one decision-ready reporting layer, including risk and exception flags for critical deviations, threshold breaches, and performance issues that require management attention.

Forecasting & Predictive

Go beyond historical reporting with forward-looking analytics that support planning and better decision-making. We help businesses apply forecasting and predictive approaches to sales, demand, inventory, finance, and operational trends through analytics models, scenario-based planning, and forecast dashboards.
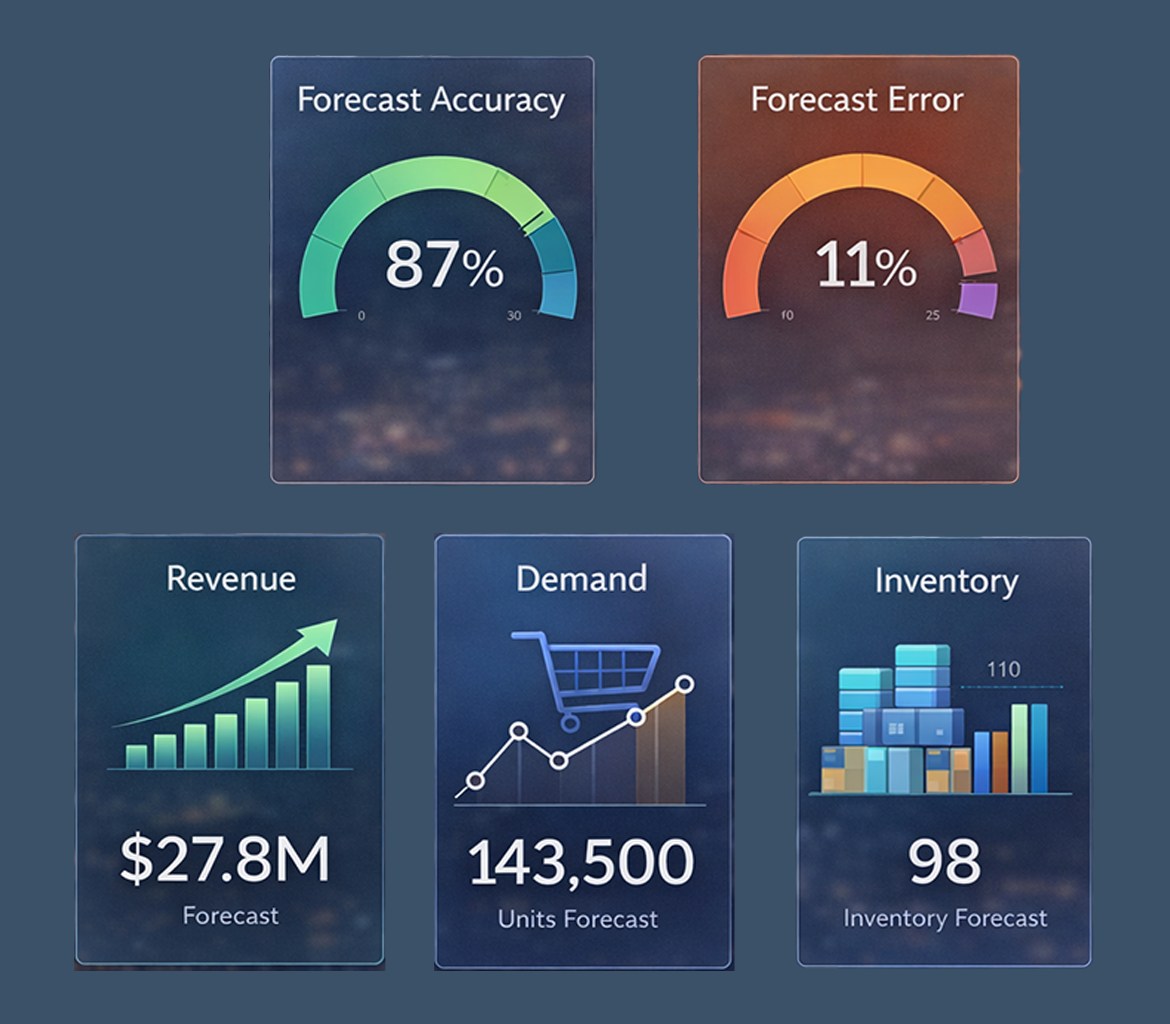
Business outcomes

  • Better planning accuracy
  • Earlier visibility into change and demand shifts
  • Reduced stockouts and overstock
  • Improved budgeting and resource allocation
  • Faster response to future performance trends

Typical Forecasting KPIs

  • Revenue forecast
  • Sales forecast
  • Demand projection
  • Inventory projection
  • Budget forecast
  • Forecast variance
  • Planning accuracy
  • Trend deviation

CTA

Analytics solutions aligned to your business needs

Tell us which area you want to improve, and we will design the right analytics solution for your environment.

Send your goals, KPI list, sample data, or a short description of what you want to track.

We will reply by email with the best-fit package, delivery option, and next steps.

Delivery Options

How you receive

The business outcome is the same. The difference is where the dashboards live and who manages the BI environment.

Option A — Retriev analytics platform

We provide dashboards on our hosted analytics platform so you can avoid setting up your own BI environment from day one.

  • Good for smaller teams that want one vendor and a faster start
  • Hosted delivery- Predictable monthly platform cost
  • Includes platform access and async support options
Option B — Power BI in your environment
We build the dashboard solution for your Microsoft environment. Your team manages the Microsoft tenant, licenses, and user access.
 
  • BYOL - Power BI licenses are purchased and managed by the customer
  • Good for companies that already use Microsoft 365 and want dashboards inside their own environment.
  • We deliver the dashboard files, KPI definitions, documentation, and recorded handover
Option C — Scheduled reporting delivery

We provide structured KPI reporting, dashboard snapshots, and executive summaries by email for teams that prefer a simpler reporting model without a live BI environment.

  • Suitable for monthly reporting packs, KPI summaries, and executive visibility
  • Includes email delivery, reporting structure, and async support options

Available export formats

  • Excel
  • CSV
  • PDF
  • PowerPoint-ready management reports

Bento

© 2025 Bento. All rights reserved.

Contact

123 Digital Avenue, Tech City, TX 75001

info@bentoagency.com

+1 (555) 123-4567

Transform Your Digital Presence

Partner with Bento to elevate your brand in the digital landscape.

Thank You, we'll be in touch soon.